


Those of us who grew up with Windows NT are no stranger to performance monitoring. However, when making the transition from Windows NT to Windows 2000, it’s easy to continue monitoring the same sorts of counters you monitored in Windows NT. After all, keeping an eye on your server’s processor utilization and memory usage are still very important things to do. What many people don’t realize, though, is that Windows 2000 is a much more complex operating system than Windows NT, and it has more system functions to watch. One such group of functions is related to the Active Directory. In this article, I’ll explain how and why to monitor Active Directory’s performance.
Why Monitor Active Directory?
It seems strange at first to gather performance data on your Active Directory. However, there are several good reasons for doing so:
- The Active Directory is a big part of your system. Like any other system component, its performance can affect the rest of your system.
- Like any other Windows component, Active Directory consumes resources. You need to be aware of how many of your system’s overall resources are being consumed over the long term, so you can plan for future upgrades.
- Gathering performance data gives you a good way to see the effects of any optimization efforts that you might attempt, and provides a great way for diagnosing problems when they occur.
Event Viewer
The two main tools for watching the Active Directory are the Event Viewer console and the Performance console. The Event Viewer console allows you to see detailed information relating to the Active Directory in the form of log files. You can access this information by clicking the Start button and selecting Programs|Administrative Tools|Event Viewer from the menu.
The Windows 2000 Event Viewer contains several more log files than the Windows NT Event Viewer. One of these logs is specifically dedicated to the Active Directory. As you can see in Figure 1, the Directory Service log contains information, warnings, and errors generated by the Active Directory.
Figure 1: The Event Viewer lets you see information, warnings, and errors that related to your Active Directory.
As with the Windows NT Event Viewer, the Windows 2000 Event Viewer contains all the basic functionality you’ve come to expect. For example, if you’re trying to hunt down a specific error, you can export the log and send it to tech support or pull it into a spreadsheet to search for the error itself.
Performance Console
The other main tool used for watching over Active Directory is the Performance Console. The Performance Console’s purpose is to allow you to record and view the performance of specific aspects of your system. For example, you can use the Performance Console to check your processor’s current workload, or you can record your processor’s utilization over a longer term, such as overnight. As with the Event Viewer, the Performance Console is actually a snap-in for Microsoft Management Console. You can access the Performance Console from the Start menu at Programs|Administrative Tools|Performance. When the Performance Console loads, you’ll find that it’s strikingly similar to the Windows NT Performance Monitor.
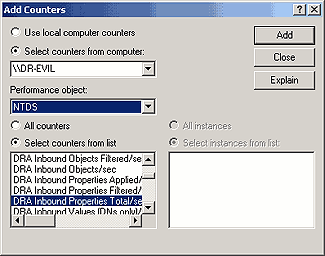
To monitor your Active Directory, navigate through the Performance Console to Console Root|System Monitor. With System Monitor selected, right-click on the System Monitor Details pane (the right side of the window) and select the Add Counters command from the context menu. When you do, you’ll see the Add Counters dialog box. As you can see in Figure 2, this dialog box consists of a section in which you select the computer you want to monitor, a Performance Object section for selecting the type of counters you want to use, and a section in which you select the individual counters. As you can see in Figure 2, all the Active Directory-related counters fall under the NTDS section of the Performance Object drop-down list.
 |
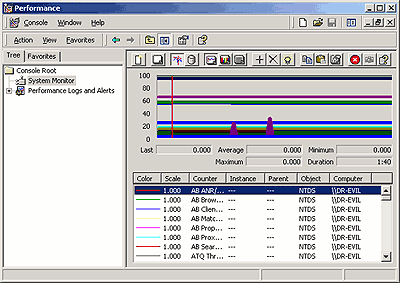
Directly below the Performance Object section are two radio buttons that allow you to either select counters from the list or implement all the available counters. I personally recommend selecting the individual counters from the list–as you can see in Figure 3, looking at all the counters at once can be a bit difficult, to say the least.
 |
To load the specific counters you want to look at, make sure the Select Counters From List radio button is selected in the Add Counters dialog box. Now, scroll through the list of available counters to locate a counter that relates to the performance statistic you want to monitor. I’ll write a description of some of the more popular Active Directory-related counters in part 2 of this article series; but for now, there’s another way for you to figure out which counter you should use.
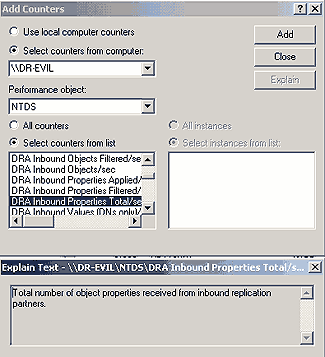
One of the best features of the Windows 2000 Performance Console is that you can get an explanation of what the various counters mean. If you’ve ever tried to use the Windows NT System Monitor, then you realize just how valuable this new feature is. To get a description of a counter, select a counter from the list and click the Explain button. As you can see in Figure 4, you’ll get a plain English explanation of exactly what the counter does. In the case of the counter in the figure, the description Total number of object properties received from inbound replication partners is much easier to understand than the counter’s name, DRA Inbound Properties Total / Sec.
 |
So far you’ve seen that you can use many different counters to monitor Active Directory. In part 2 of this article series (
Using System Monitor Counters
), I’ll explain which counters you should routinely monitor, and why. //
Brien M. Posey is an MCSE who works as a freelance writer. His past experience includes working as the Director of Information Systems for a national chain of health care facilities and as a network engineer for the Department of Defense. Because of the extremely high volume of e-mail that Brien receives, it’s impossible for him to respond to every message, although he does read them all.