A server is a computer or system that is designed to behave as a repository and provide computing resources, services, data and programs to other computers (clients) connected to the network. Technically, whenever a computer shares resources with a client, it is considered a server. This also means a system can act as a client and server simultaneously.
There are several types of servers — file servers, print servers, application servers, Domain Name System (DNS) servers, mail servers, web servers, database servers, virtual servers, proxy servers and monitoring and management servers. Each server type performs different functions and a network may consist of one or more servers and/or server types.
The amount of data that we are consuming is growing with each passing day. Enterprises are scaling to accommodate increasing infrastructure needs and multiple servers are being added to networks. Manually handling tasks associated with critical applications and server management is cumbersome and costly.
Employing network server management software can help information technology (IT) administrators streamline the management of network health and improve the efficiency, security and uptime of network servers.
Also read: The Ultimate Guide To Server Management Software
How to Choose Network Server Management Software
When choosing a network server management tool, here is what you should consider:
- A server management tool must visualize data. A centralized view of your network across all servers makes it easy to monitor and manage network health.
- Server management software must provide process automation. This includes lightweight task automation and critical task handling.
- Built-in analytics capabilities and reporting are a must. This will help you quickly identify the root cause of a network irregularity or inefficiency and take action to resolve the issue.
Here is all you should know about LogicMonitor and ManageEngine OpManager.
LogicMonitor Overview
LogicMonitor is a unified network monitoring platform for your networking equipment and IT infrastructure. The platform provides a 360-degree view of your network with custom dashboards and powerful visualizations so you can promptly identify and troubleshoot issues.
Whether resources are on-premises, in the cloud or spread across multiple data centers, LogicMonitor’s lightweight, agentless collector enables you to automatically discover everything about your network.
All you have to do is enter an IP address or hostname and within minutes you will receive the monitoring, graphing and alerting you need to monitor, maintain and optimize network infrastructure.
LogicMonitor Features
- Monitoring via IPFIX, NBAR2, WMI, sFlow, NetFlow, jFlow and/or SNMP.
- Monitoring for firewalls, switches, routers, load balancers, wireless devices, etc.
- Support for software-defined networking (SD-WAN) and cloud-based networks. LogicMonitor works in collaboration with Cisco SD-WAN product teams to ensure you can monitor and manage the performance and health of traditional and next-generation infrastructure within a sole platform.
- Dashboards, intelligent anomaly detection and alerting, root cause analysis and network topology mapping provide detailed insights into network performance and help identify performance bottlenecks and bandwidth issues.
- Root cause analysis and intelligent anomaly detection and alerting distinguish service impacting alerts from non-service impacting alerts. This reduces alert noise and helps you streamline workflows.
- Automated setup and configuration with the active discovery of new devices.
- With built-in integrations for tools like Slack, HipChat, PagerDuty, Connectwise, Autotask and ServiceNow, you can streamline workflows and keep your teams connected.
- You can identify performance trends with pre-configured alert thresholds.
- Offers a free 14-day trial for unlimited devices.
ManageEngine OpManager Overview
ManageEngine OpManager Plus is an end-to-end network management software that offers a unified approach to manage and scale multi-vendor enterprise infrastructures. The solution provides in-depth visibility into the working of critical network resources like servers, virtual servers, switches, network devices, WAN or VoIP links, etc.
Application Manager provides critical information such as threat count and PGSQL database details, CPU and memory usage, etc. This information is crucial to track the performance of OpManager Plus.
Other features include storage monitoring, bandwidth and traffic analysis, configuration management, firewall management and forensic log analysis and IP address and switch port management.
ManageEngine OpManager Features
- You can track and manage firewall rules and policies, enforce role-based access control, ensure critical compliance standards are met, push configuration changes across connected devices and track and monitor proxy servers and VPNs in real time.
- You can track the performance of on-premises and cloud infrastructure and perform code-level diagnostics.
- You can monitor the performance metrics of over 1,000 network devices. You can manage IP addresses and switch ports, analyze and improve network traffic patterns and track network bandwidth consumption.
- Advanced bandwidth monitoring capabilities include support for AppFlow, NetStream, IPFIX, jFlow, sFlow and NetFlow and enable you to gain real-time visibility into bandwidth performance.
- You can track over 100 server performance metrics, including health and availability, for a variety of vendor server infrastructure models. These include VMware, Cisco, Hyper-V, Dell, etc.
- You can leverage advanced security assessment module (ASAM) for flow-based anomaly detection and network behavior analysis.
- An integrated dashboard with visualization tools like 3D floor views and business views provides in-depth, real-time visibility.
- Instant alerts via multiple channels like email, SMS and Slack help in proactive fault detection.
- The solution provides over 200 built-in reports for advanced performance analytics.
- Pricing plans and quotes are available on request.
LogicMonitor vs ManageEngine OpManager
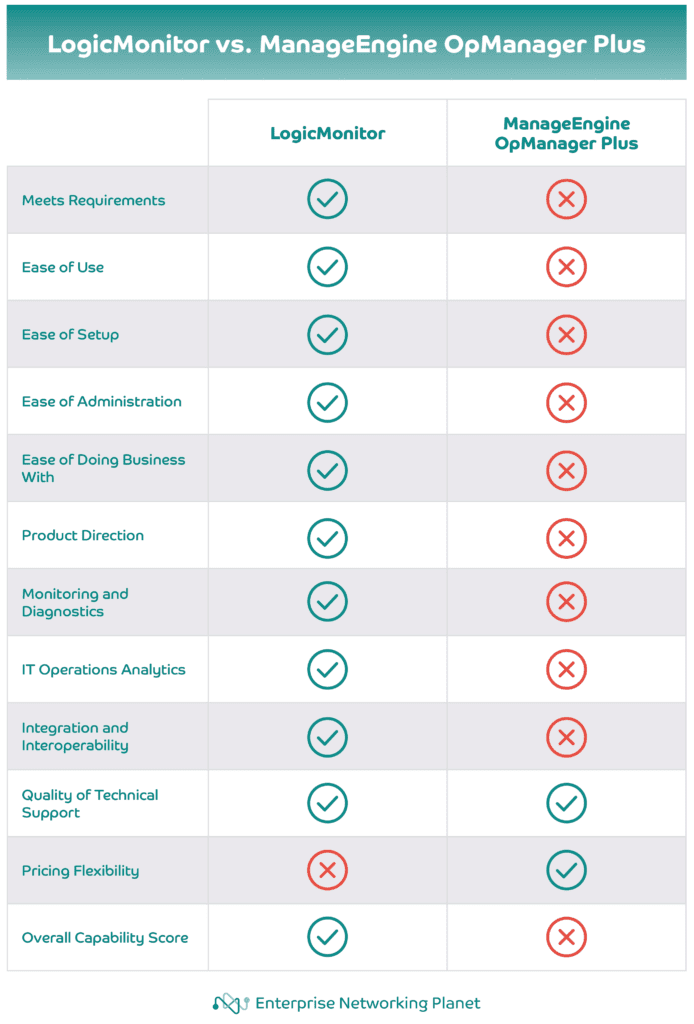
Here is a head-to-head comparison of LogicMonitor and ManageEngine OpManager Plus:

As the table above indicates, LogicMonitor is an all-around network server management software, offering a unified platform for network monitoring and management. Its many features include advanced AIOps capabilities like anomaly detection, root cause analysis and dynamic thresholds, auto-generated topology mapping, and more than 2,000 integrations to better understand how your network is affecting service delivery. Overall, the solution is easy to use and intuitive.
ManageEngine OpManager Plus is packed with out-of-the-box capabilities for monitoring and managing the performance of critical IT resources. The solution eliminates the need for multiple monitoring tools and removes operational bottlenecks, provides greater IT infrastructure visibility and helps optimize and gain maximum output from network resources.
Gauge the effectiveness of both network server management tools and integrate the solution that best meets your enterprise needs.
Read next: The Future of Network Management with AIOps


