It’s hardly a secret that enterprise networks have become almost impossible to manage and troubleshoot, especially when you consider the complexities of modern day connectivity, applications and services. What’s more, SDN (Software Defined Networking), SDDC (Software Designed Data Centers), and multi-site hybrid solutions can add layers of complexity to the management of networks. Fluke Networks aims to quell those problems with the latest iteration of Visual TruView, a network monitoring, performance, application and troubleshooting tool. Version 9, announced today, brings multiple enhancements and new capabilities to the market to make network administrators’ jobs easier.
A Closer Look at Visual TruView 9.0
When I last reviewed Visual TruView, I deemed it a very capable product that offered a plethora of tools and capabilities, but complex to use and lacking when trying to solve networking problems at the user level. The ability to delve deeper into network traffic and application performance issues has taken on increased importance, especially with the number of applications and services delivered to users from the data center via web technologies.
Visual TruView V9.0 offers an intuitive GUI and easily navigable pull-down menus
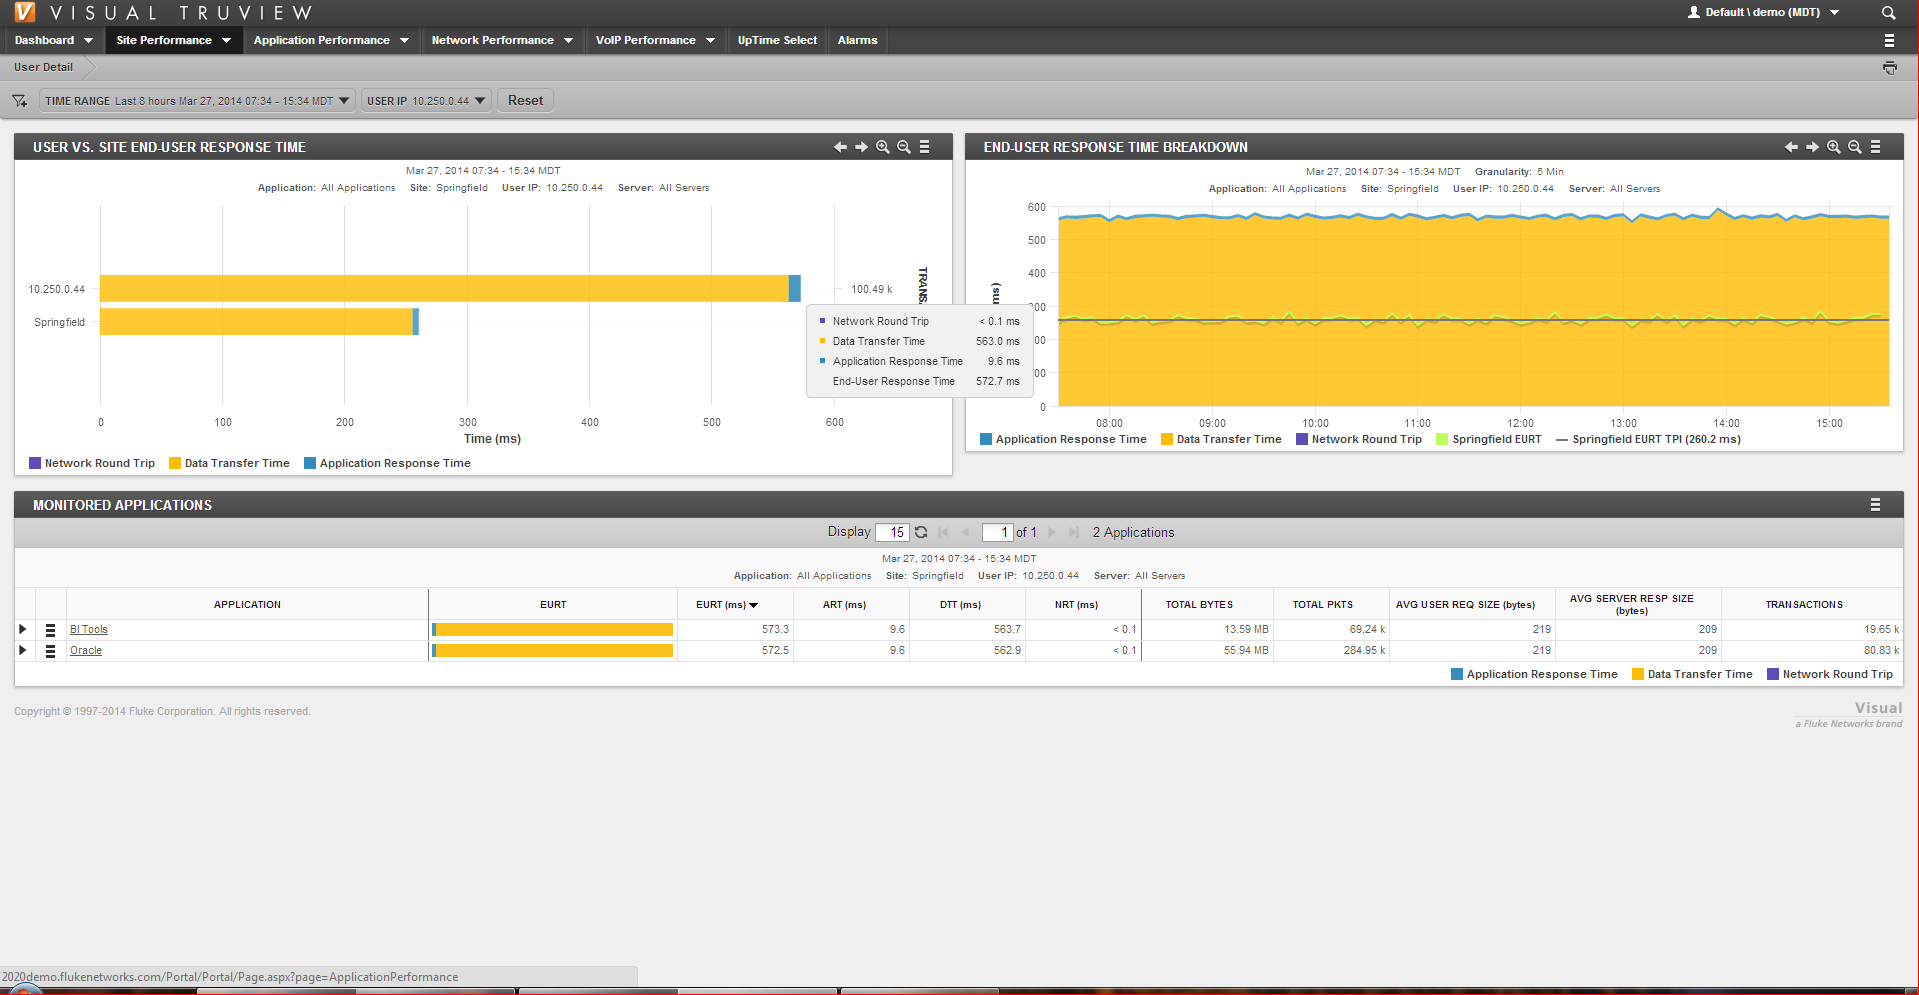
Visual TruView 9.0 introduces the capability to fully explore a user connection and then drill down further into packet information, trends and other critical elements that can pinpoint the source of connectivity problems. For example, say a user claims he’s having an application performance issue, where an application either times out or performs slowly. In the past, an administrator would only be able to look at application performance, without any correlation to an individual user.
In-depth information that compares a user’s performance experience to overall application performance makes it easier to spot problems
Now an administrator can drill down into the user’s information and then trend his application performance against the overall performance of the application. That will help an administrator to quickly zero in on where the problem is.
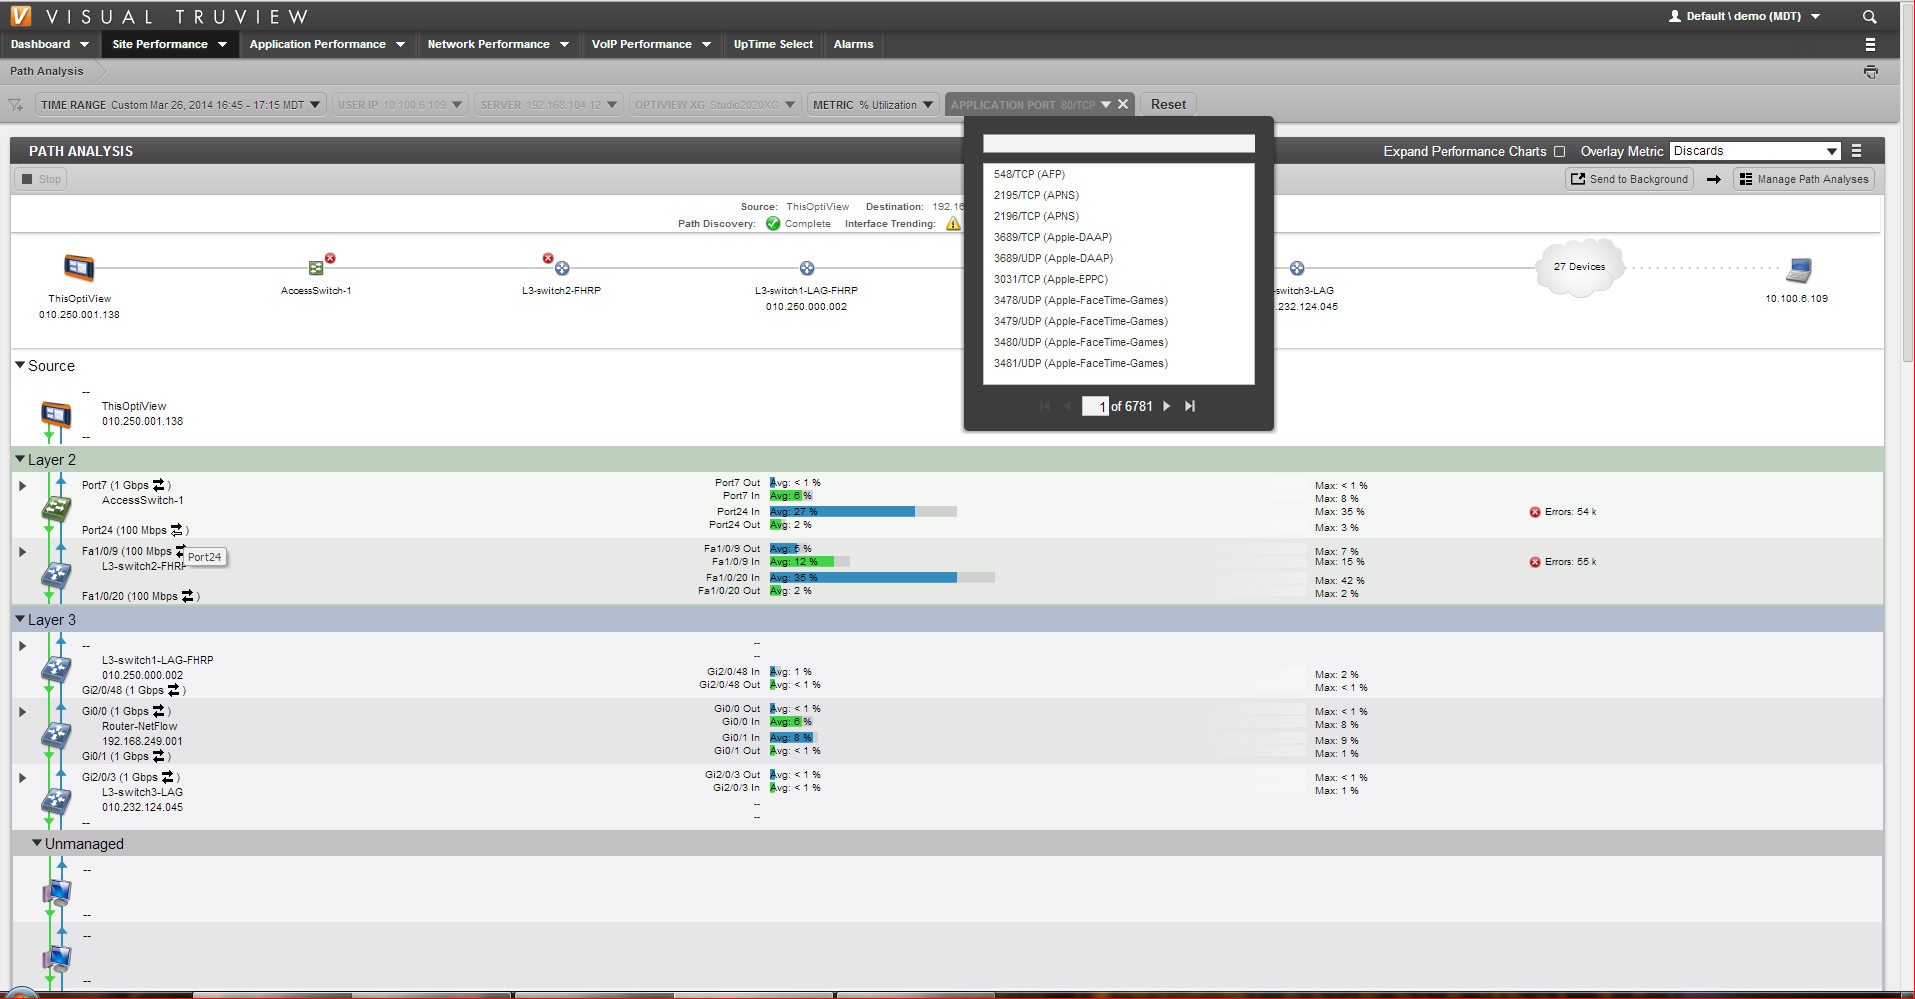
What’s more, an administrator can launch a detailed path analysis to determine what network components were involved in the connection, how the data packets traversed the network and what problems, if any, were encountered. That path analysis capability does require an OptiView XG Network Analysis Tablet installed on the subject network, however.
Detailed packet path traces are readily available and offered visually for administrators trying to track down a problem
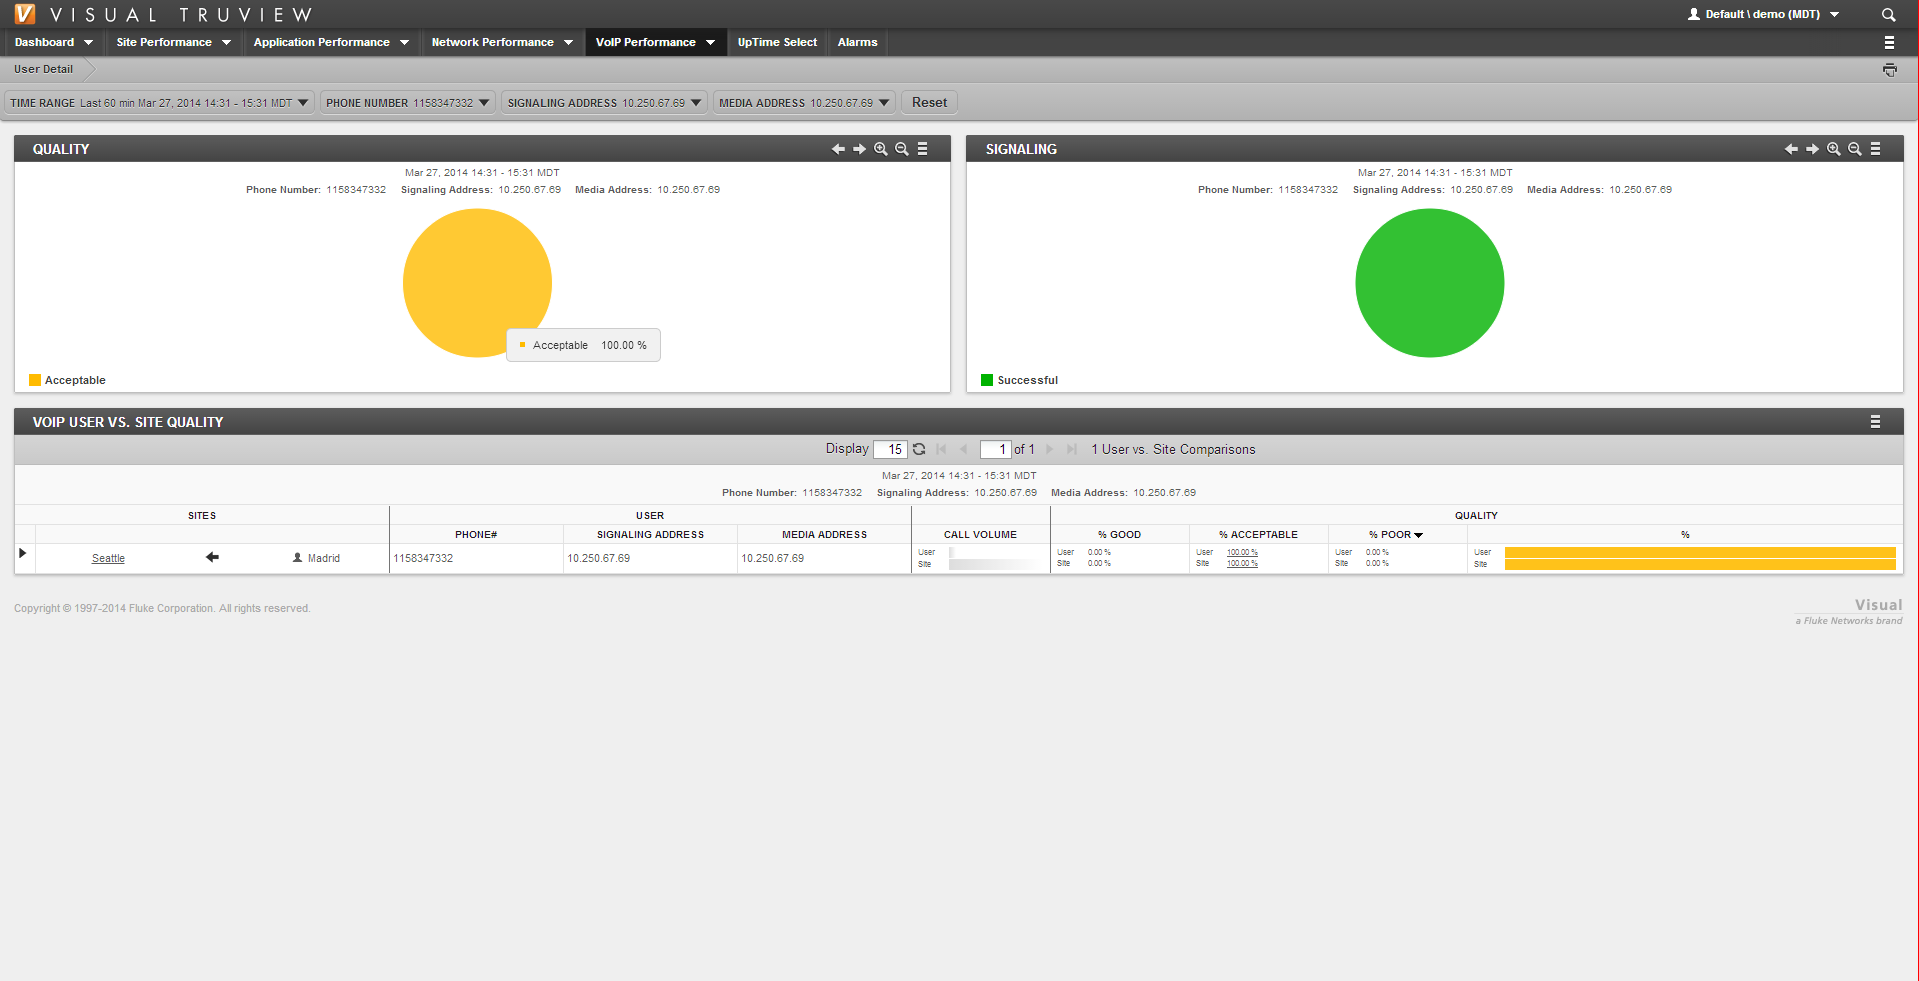
The user-level diagnostic capabilities extend beyond application performance and can be used to examine VoIP traffic as well, to quickly investigate any problems with VoiP phones and users. The product offers a highly detailed view into VoIP traffic, filtered by phone number, and can be drilled down into to determine what traffic problems may exist.
VoIP traffic can be analyzed at the endpoint level to highlight communications problems and point to possible solutions
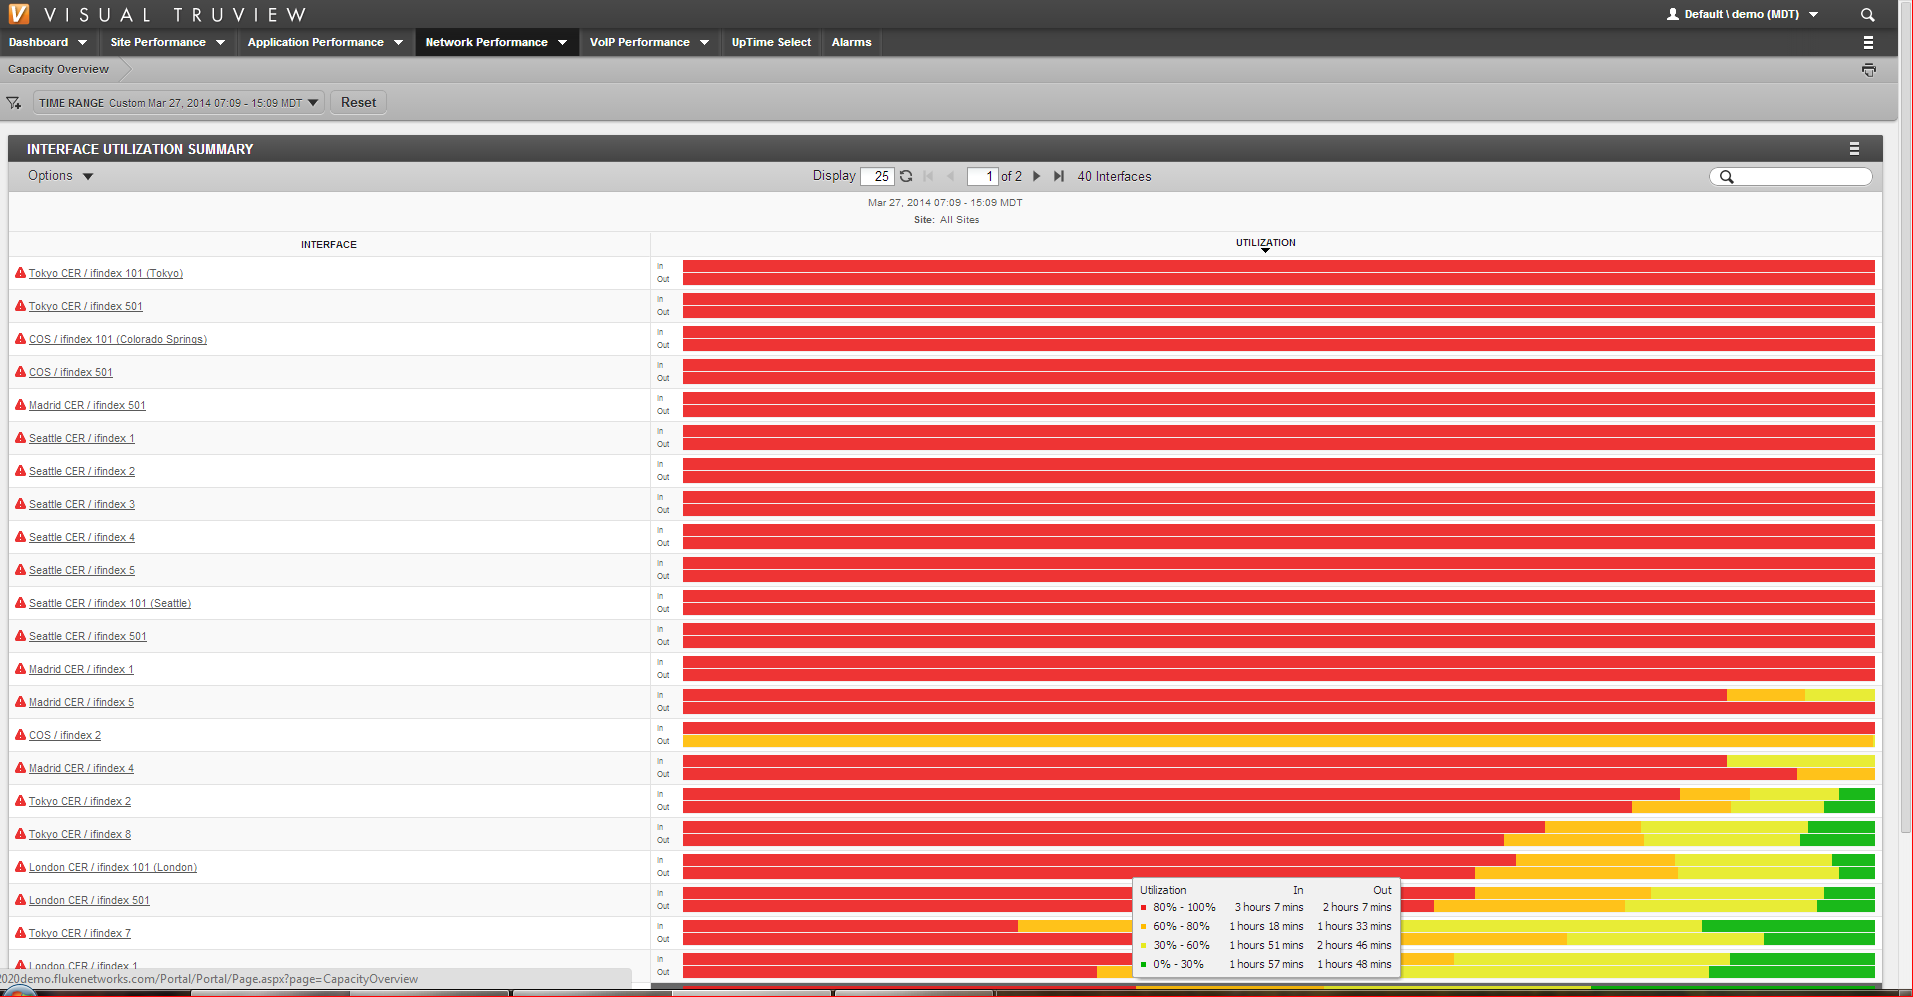
Although Visual TruView 9.0 offers the ability to examine network issues at the user level, the product does not ignore the big picture. A new network utilization module provides information on the overall usage of the network, but with a twist. The visual report offers a trend-centric view based upon a broad time range to show minute-by-minute utilization. That makes it easier to drill down into what actual (not synthetic) network utilization was over time. Administrators can then correlate that information with other data to build a big picture on utilization and delve into what applications, what data centers, what connectivity options and what users (via IP Address) consumed the bandwidth.
Graphing network utilization offers administrators a way to determine when and how network resources were used and provides a quick indication of where resources may need to be relocated
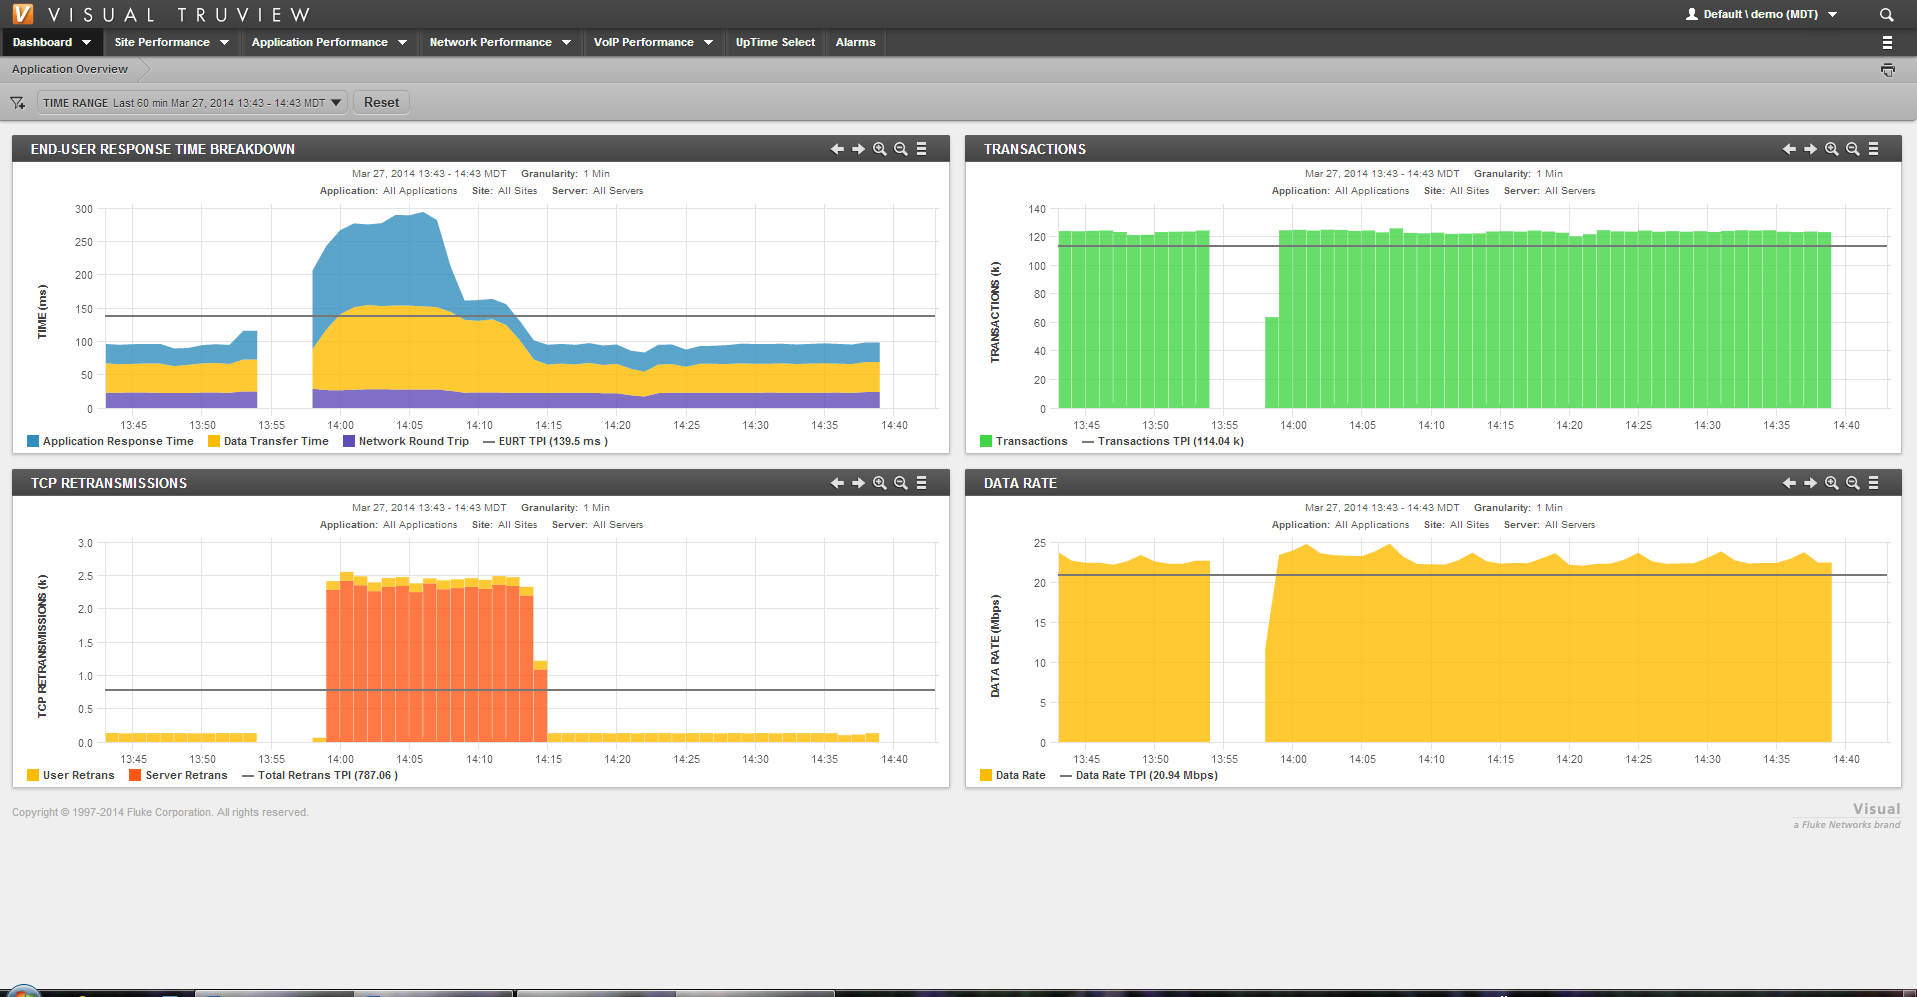
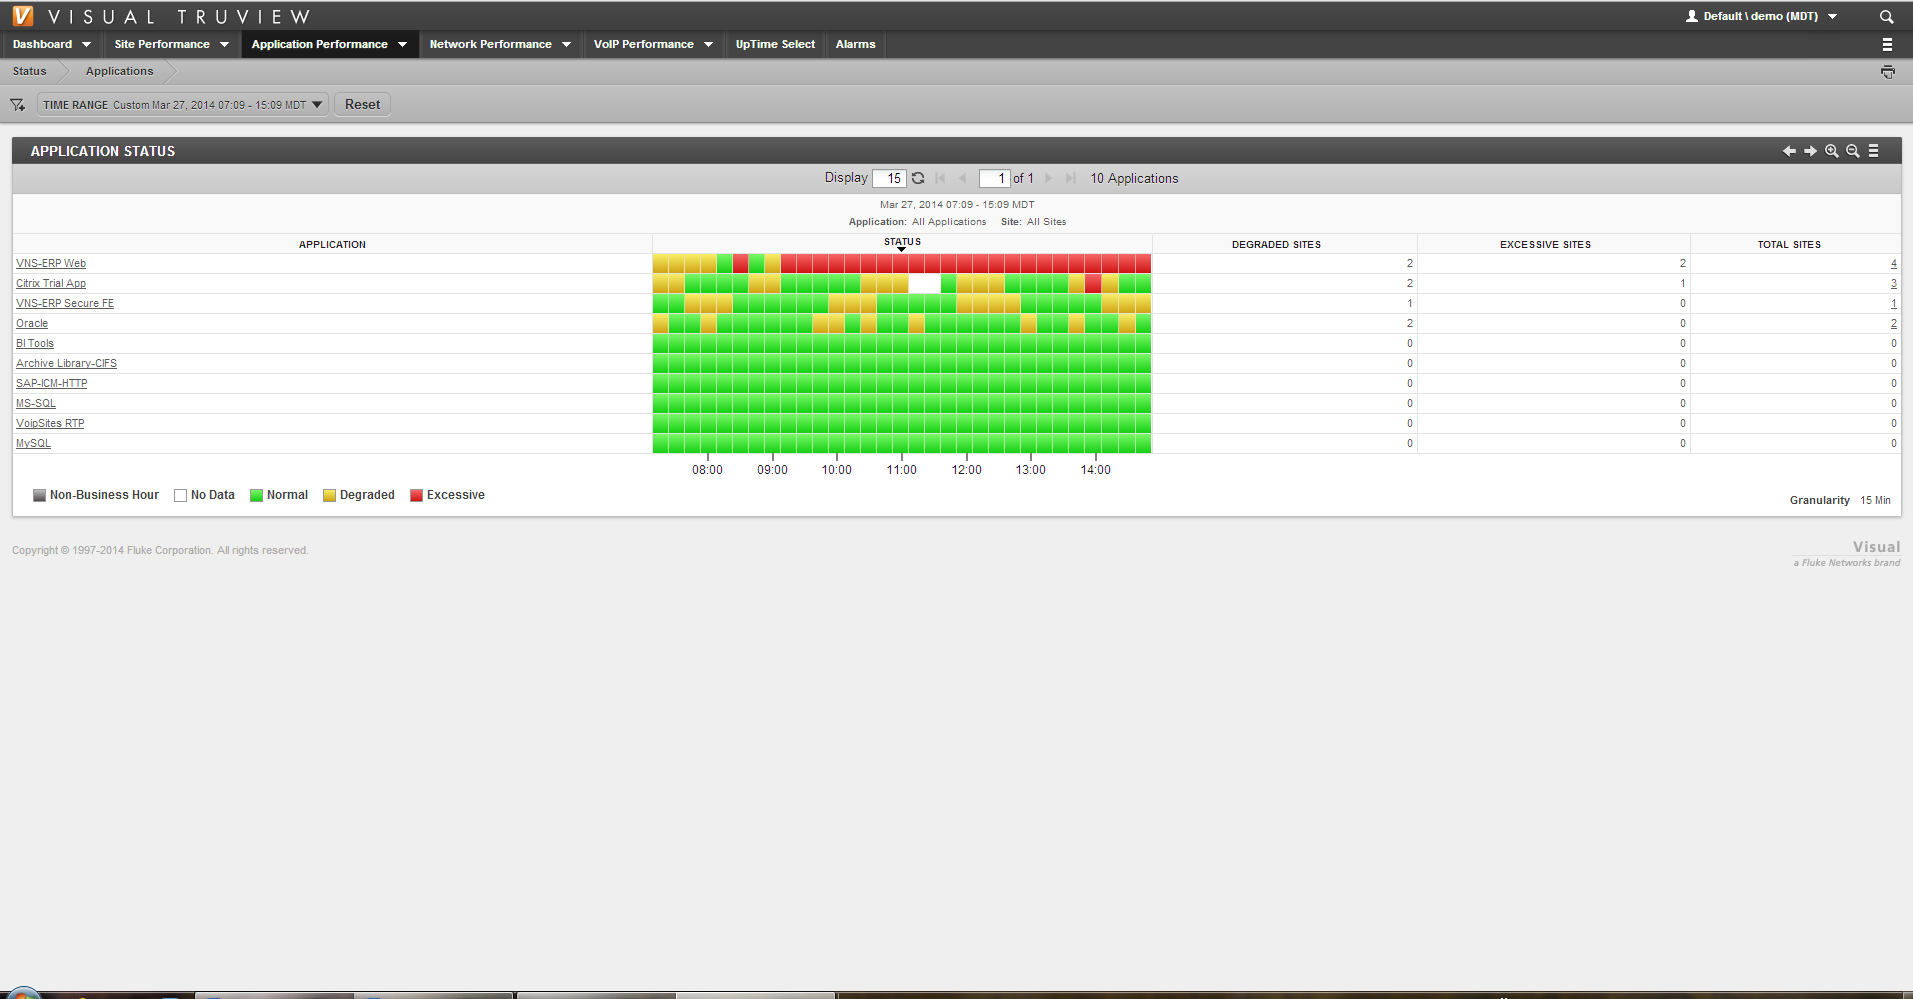
Fluke Networks has also improved the ability to analyze application usage and performance. Enhanced dashboards show application performance based upon actual recorded data that can be filtered by date ranges. The visual representation quickly highlights where and when performance problems appeared.
Administrators can quickly determine what applications have encountered performance problems
Performance is only one aspect of how applications are used across an enterprise network. Administrators must also account for other factors, such as overall usage, servers involved, sites and so on. Visual TruView 9.0 provides all of that information in a configurable application analysis screen, which shows everything from response times to details on what servers or users experienced traffic induced delays. The product also ranks applications and servers by performance and response times, allowing administrators to quickly tune slow sites to increase performance.
Version 9 also brings forth a plethora of usability enhancements, all designed to make the product easier to use and understand. The idea here is to unify network performance management and troubleshooting in a platform accessible to a variety of technical support folks. Businesses no longer have to invest in different tools for applications, networks, VoiP and web services, and can now unify all of those elements under one product.
Visual TruView 9.0 is appliance-based and available under several different models ranging in capacity, performance and throughput. However, the software feature set is the same across the appliance family. Prices start at $25,000 for the entry-level TruView appliance and scales up to $100,000 for the top-of-the-line TruView Appliance.


