Troubleshooting network performance problems sometimes demands a deep dive into packet payloads. The latest iteration of Solarwinds Network Performance Monitor (NPM) enables those deep dives. Solarwinds NPM version 11 introduces several enhancements, capabilities and features to significantly enhance network troubleshooting.
What’s New in Solarwinds NPM Version 11
With each release of NPM, Solarwinds has expanded the feature set. In my past reviews of products from Solarwinds, including Solarwinds UDT, Solarwinds IPAM, and Solarwinds FSM, I noted how well the company integrates new capabilities into each revision of their products. Version 11 of Network Performance Monitor follows that pattern.
Version 11 of NPM introduces what may well be a game changer in the monitoring and analysis segment of the network management market: Deep Packet Inspection (DPI) analysis capabilities. Unlike stateful packet inspection (SPI), which only looks at a packet’s header and footer, DPI examines the header, footer, source and destination of incoming packets as well as the data part of the packet, searching for illegal statements and pre-defined criteria, allowing administrators to define rules that determine whether the traffic should pass through the network.
Simply put, DPI makes it possible to find, identify, classify, reroute or block packets and make determinations based on the content contained in the data packets. It also helps administrators ascertain whether the traffic is secure, compliant, permitted and genuinely required by the end-user/endpoint application.
Ultimately, DPI allows NPM (Network Performance Monitoring) and APM (Application Performance Monitoring) to be combined in a single management silo. That in turn brings a new capability to network managers, one referred to as AA-NPM (Application Aware Network Performance Monitoring). AA-NPM is the key to delivering deeper metrics about both applications and traffic simultaneously, greatly simplifying the performance troubleshooting process.
Other enhancements to the product include:
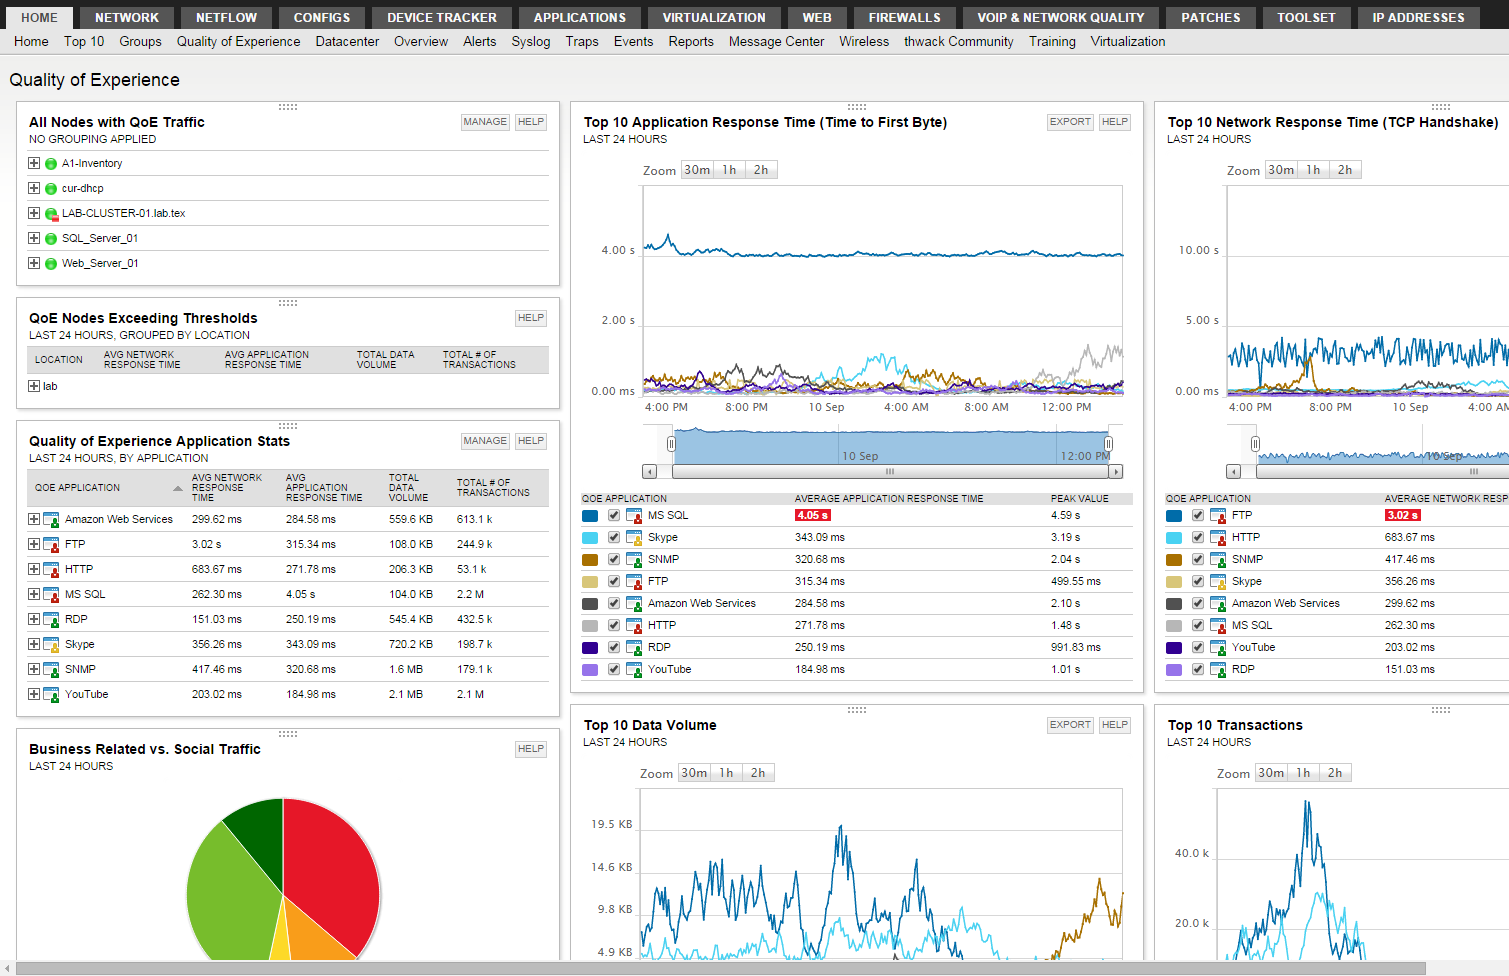
- Quality Experience Dashboard: Enables administrators to quickly find underlying issues for network performance concerns using a visual model that highlights elements such as latency, data volume and transaction counts.
- Application Dashboard: Allows administrators to delve into application details and chart elements such as application response time, network response time, data volume and transactions.
- Traffic Categorization: New charts and tables visualize the types of traffic and how those traffic types consume bandwidth across the enterprise.
- Packet Analysis Sensors: Network Packet Analysis Sensors (NPAS) can monitor traffic at SPAN/mirror ports and directly on Windows servers.
While those enhancements are notable, the new Deep Packet Inspection analysis capabilities bring the most value to the product, enhancing all monitoring, troubleshooting and analysis capabilities offered by NPM. Case in point is NPM v11’s ability to perform application aware network performance monitoring.
The Quality of Experience Dashboard offers details on application performance, network performance and the overall quality of usage experiences.
When investigating application or network performance issues, administrators can now drill down further into the details of each application and look at information such as response time and details about the application server. CPU load, memory usage and packet loss data round out the picture and give administrators a fuller understanding of how well an application, its servers, and the surrounding network are performing. That server-to-endpoint analytical capability should prove to be the ideal for troubleshooting many application-related issues.
Hands-On with NPM v11
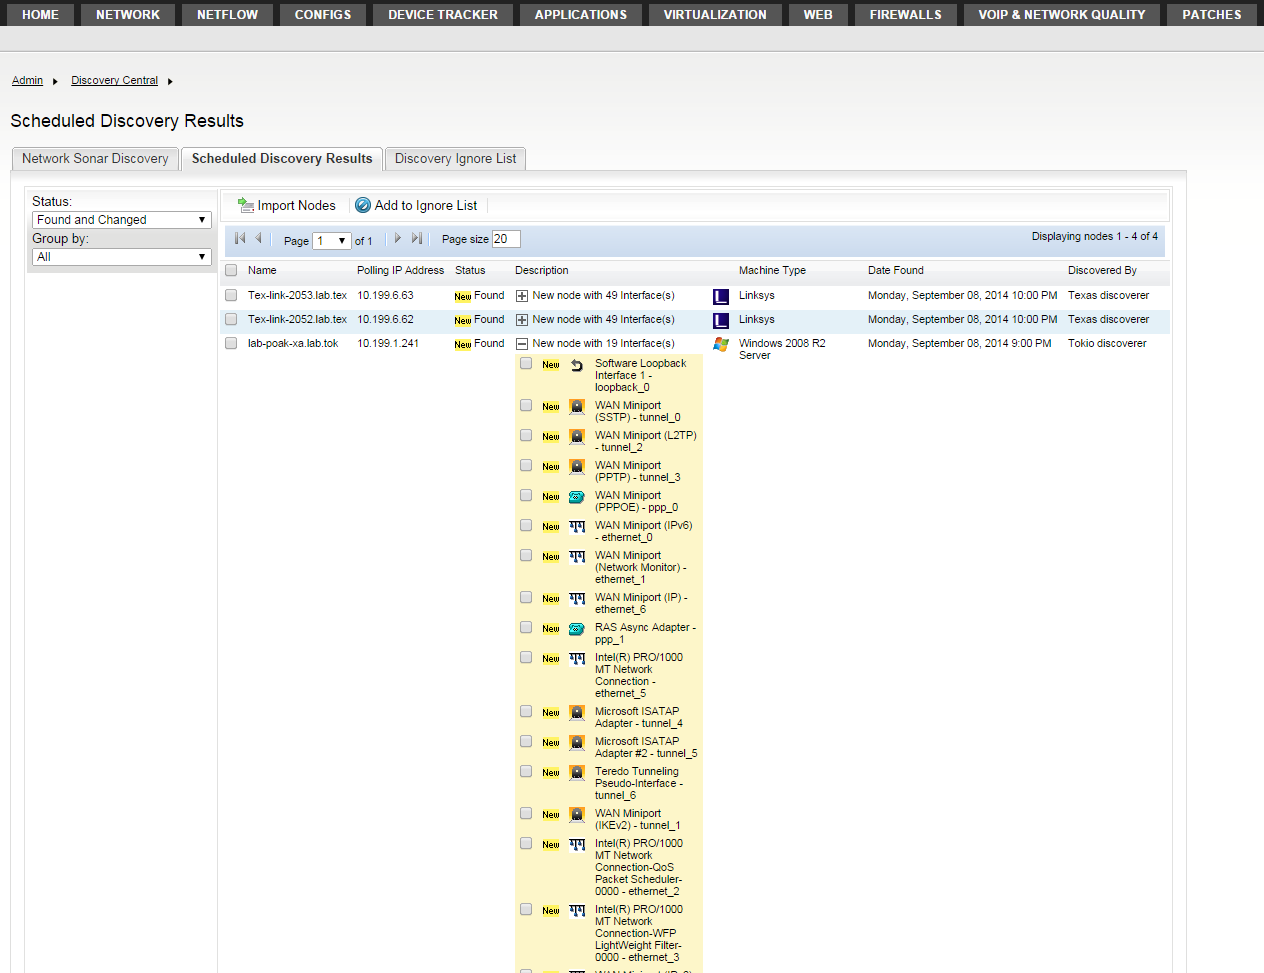
Network managers responsible for day-to-day operations will find a strong ally in NPM v11. Chock-full of tools, analysis capabilities, reports and dashboards, the product offers immediate value even during installation. NPM v11 has the capability to auto-discover physical and virtual devices on the network using ICMP, SNMP and WMI. In other words, the product will dynamically discover switches, firewalls, routers, wireless access points, servers, and any other SNMP-enabled devices. What’s more, the discovery process continues to run in the background and informs administrators when new devices join the network.
Once devices are discovered, administrators can choose to import those devices into NPM for monitoring and management. A wizard that guides administrators through the import process makes the process exceptionally easy. While importing devices, I was able to choose how the devices should be grouped, based upon filtering parameters, such as device type, interface or other elements specific to a particular device group.
NPM’s discovery engine finds newly attached devices and then offers administrators a simplified way to add those discovered devices to the NPM management systems. Discovery can be scheduled or manually initiated when needed.
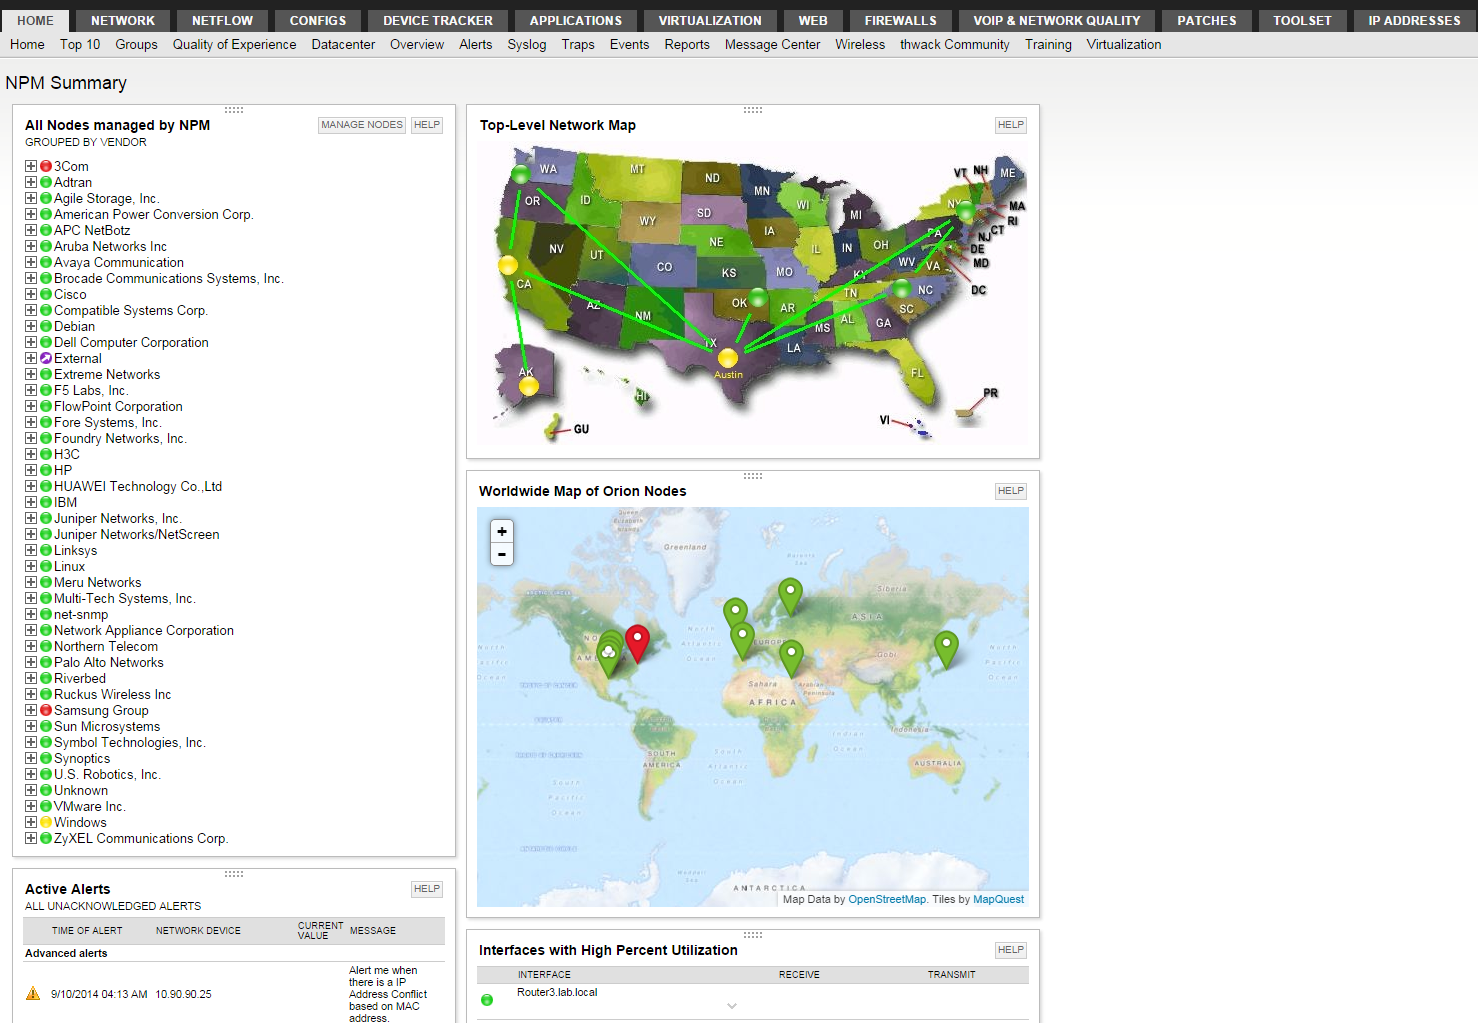
First-time users will most likely access NPM v11 using the customizable web console-based dashboard, which defaults to the NPM summary page, which shows actionable elements such as active alerts, high utilization events, hardware health and most recent events.
The NPM summary screen is the primary entry point into NPM. From the summary screen, it is very easy to ascertain the status of the network and delve deeper into issues using drill-down controls, submenus and other navigation tools.
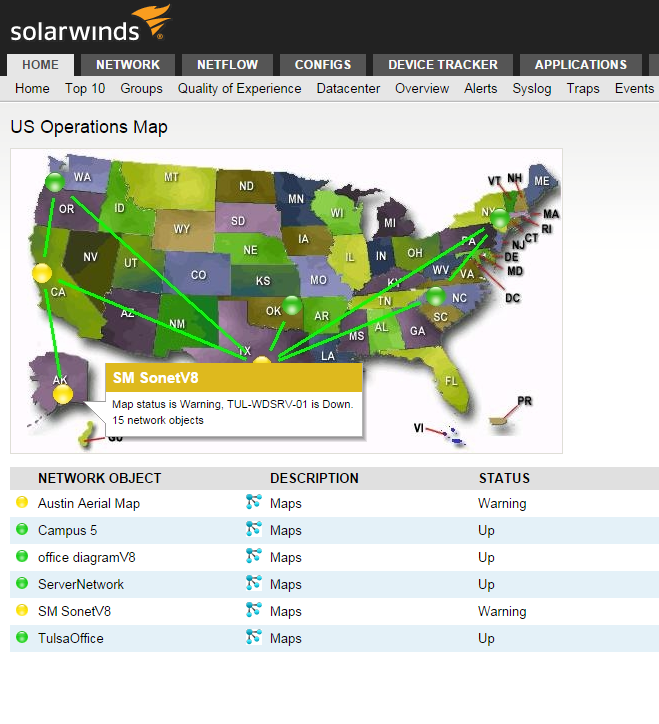
Further easing the management process is the Network Atlas, used to identify all physical and virtual elements on the network. It works hand-in-hand with the mapping tool to create a visual representation of the network. That visual representation offers color-coded links to show the status of the devices on the map. Administrators can import images to use as a background on the map, such as states, cities, geographical maps and so forth, making it easy to identify the location of problems and where their impacts are felt.
Administrators can use the Network Atlas to create visual maps that show the location, status and pertinent information about physical and virtual connections on the network.
Perhaps one of the most powerful capabilities offered by NPM v11 is the ability to drill down into the minutest details from the “all nodes” applet on the dashboard. Hovering over a node on the dashboard provides the current status of the node, clicking on the “plus” icon offers additional information, and clicking on the node name launches a detailed information screen.
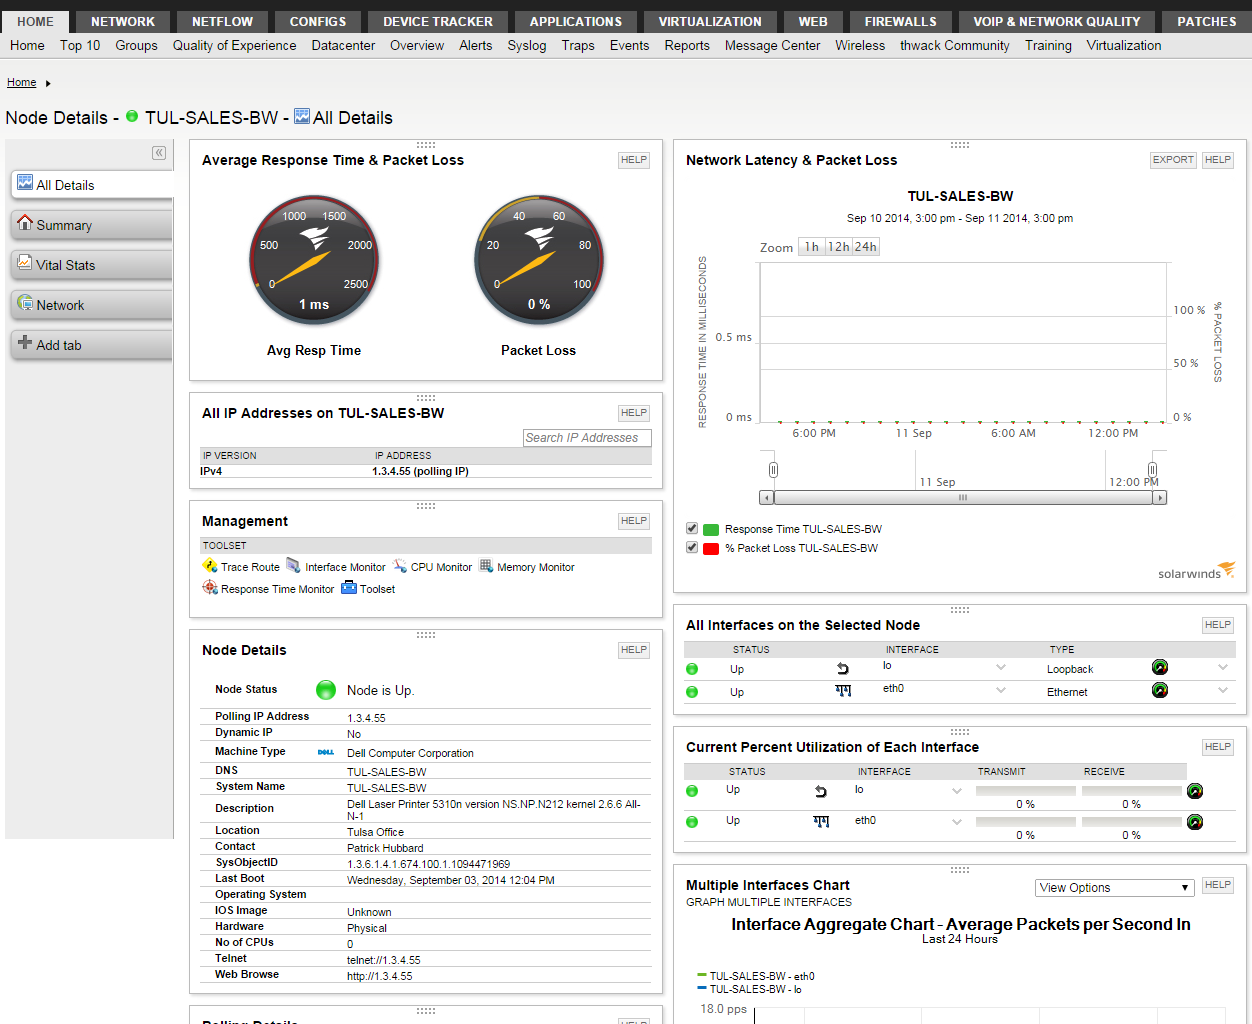
The node details page provides a plethora of information.
Administrators can quickly troubleshoot most any problem by drilling down into the Node Details page, where they can further expose elements shown on the details dashboard and leverage ability to filter by time range, connections and other settings.
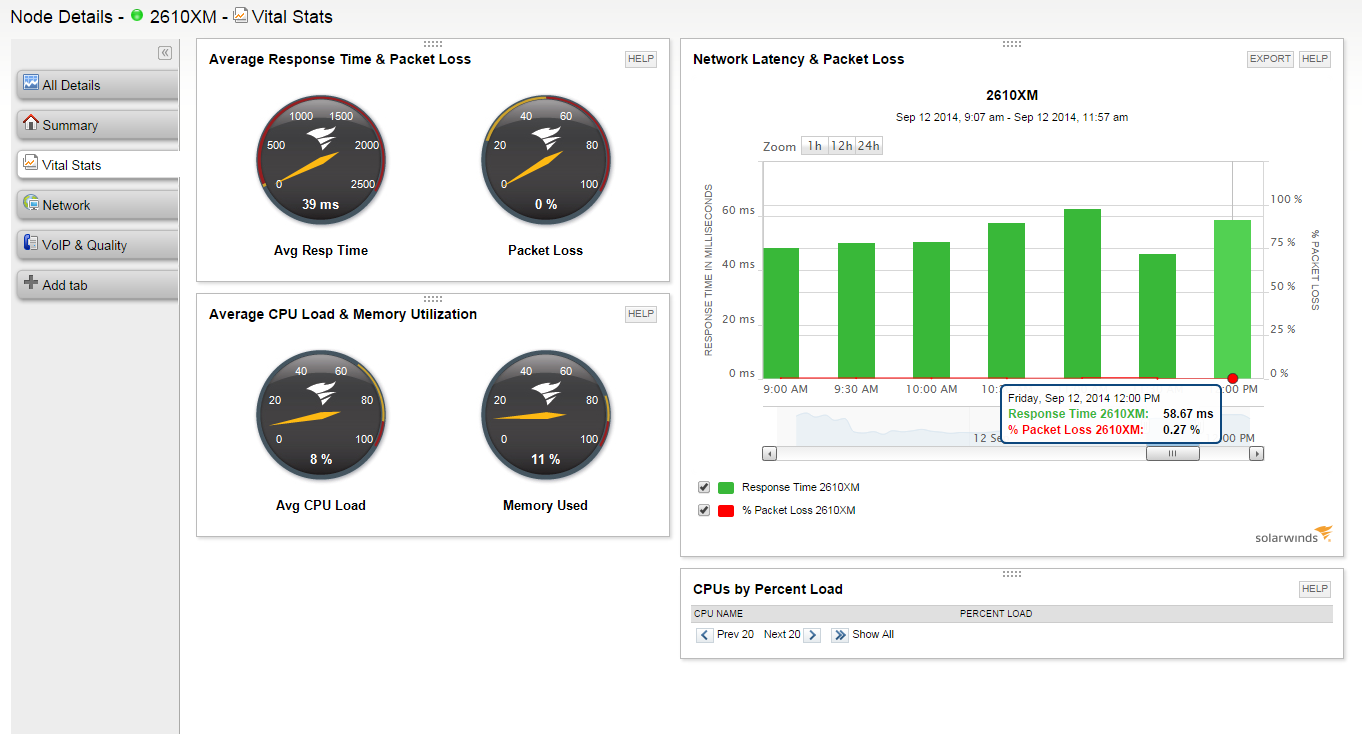
The Vital Stats screen of the Node Details dashboard provides critical information such as latency and packet loss in both chart and graphical formats.
One of the most relevant troubleshooting capabilities comes from the ability to delve into transmission statistics, such as latency and lost packets. Using that information, administrators can fully trace performance issues to their root causes, instead of making assumptions about whether performance issues are related to applications, application servers, internet connections, routers or something else completely.
Therein lies the true value of Solarwinds NPM v11. It can be summed up as eliminating many of the time-wasting steps of troubleshooting that are normally based upon assumptions and not facts or evidence gathered.


